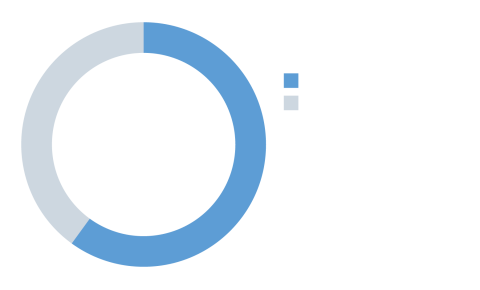
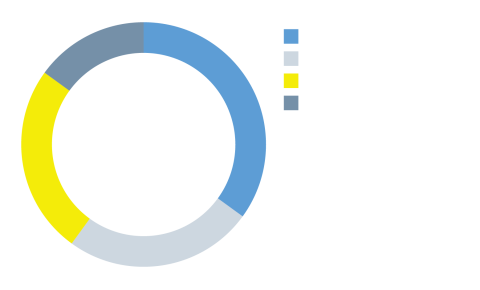
Charting the New 60/40 with Private Markets
Source: Bloomberg, as of 06/30/24. Note: Portfolio investment from 6/30/1999-6/30/2024. “Equities” is represented by the MSCI ACWI Index. “Fixed Income” is represented by the Bloomberg Barclays Global Aggregate Index. “Private Equity” is represented by the MSCI Burgiss Global Buyout Funds Index. “Private Credit” is represented by the Cambridge Associates Private Credit Index. For illustrative purposes only. Past performance is not indicative of future results. There is no assurance that any portfolio objectives can be achieved or that nay such portfolio will be profitable. Diversification does not eliminate the risk of loss.
Index Definitions: MSCI World Index: The MSCI World Index is a global equity index designed to track the performance of large and mid-cap companies across 23 developed world markets.
Bloomberg Barclays Global Aggregate Index: The Bloomberg Barclays aggregate Index is a measure of global investment grade debt from 24 local currency markets, including treasury, government-related, corporate and securitized fixed-rate bonds from both developed and emerging markets issuers. MSCI Burgiss Global Buyout Funds Index: The MSCI Global Buyout Funds Index is based on data compiled from historical performance records of various Global Buyout funds tracked via Burgiss since 1980. The Index is inclusive of private equity-style funds that are closed-end with manager discretion over cash flows. Cash flows are reported from LPs and the dataset is updated on a quarterly basis. The index is not transparent and cannot be independently verified because MSCI Burgiss does not identify the funds included in the index. The Burgiss Private Equity Manager Universe is also recalculated each time a new fund is added, therefore the historical performance of the index is not fixed, cannot be replicated, and will differ over time. Returns are calculated net of fees and carried interest. The Cambridge Associates Global Credit Index: The Cambridge Associates Global Private Credit Index is based on data compiled from the historical performance records of various global credit funds between 1986 and 2022 . The Credit funds included in the Cambridge Global Private Credit Index report their performance voluntarily and therefore the Index may reflect a bias towards funds with track records of success. Funds report unaudited quarterly data to Cambridge Associates when calculating the Index. The Index is not transparent and cannot be independently verified because Cambridge Associates does not identify the funds included in the Index. Because Cambridge Associates recalculates the Index each time a new fund is added, the historical performance of the Index is not fixed, cannot be replicated, and will differ over time from the data presented in this communication. Returns are net of fees. The Index returns do not represent Fund performance.
Comparisons to Benchmarks. This illustration may include comparisons of the performance of certain investment funds to published rankings, indices or similar benchmarks. These comparisons have inherent limitations and qualifications, such as limited sample size, imperfect access to information and other considerations. Selected benchmarks are shown for comparability at the asset level. There may be significant differences between the types of securities and assets typically acquired by any Fund and the investments covered by the applicable index. For example, the investments covered by the applicable index may have more liquidity than the investments held by any Fund. You cannot invest directly in an index or benchmark group. There may be other studies, rankings or benchmarks where the relative performance would be higher or lower. Additional information is available upon request.


